Excel Line Charts: Why the line drops to zero and how to avoid it
Have you ever seen a line chart in Excel that’s suddenly dropping to zero? Here’s why it happens and what to do about it:
Let’s say you have a table where you enter new sales figures every day, and a line chart connected to it. The sales figures for the last few days in the table have not yet been filled out, so the last values for the y-axis are zero. This is what the line chart could look like:
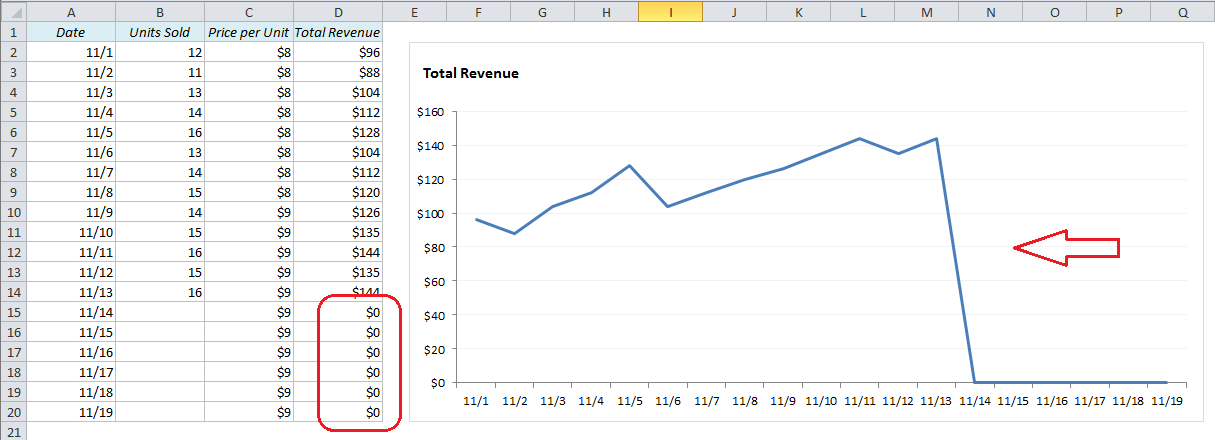
How can we get rid of this vertical line that appears after the last data entry?
The y-axis gets its data from column D, Total Revenue, which is the product of Units Sold and Price per Unit (=B2*C2, copied down). As long as we don’t have any entries for the last six days, the Total Revenue for these days would be zero. To Excel, it looks like the sales suddenly dropped from $144 to $0 overnight.
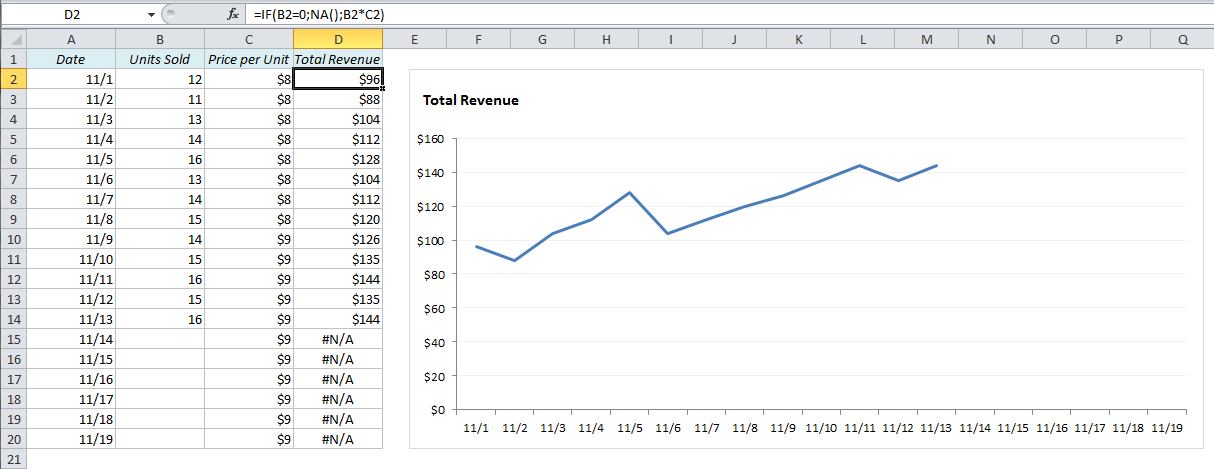
One way to solve this is to replace the zeros with #N/A. The #N/A message usually appears in lookup queries such as VLOOKUP, MATCH etc. when you search for a non-existing value, but that’s not the case here, so we have to cheat!
We’ll use a simple IF-statement in column D: IF UnitsSold = 0, then return #N/A, if not, return TotalRevenue. In Excel syntax:
=IF(B2=0,NA(),B2*C2)
(copy down)
Problem solved!
Note: If you have an older version of Excel, the NA() function won’t work. Try this instead: =IF(B2=0,#N/A,B2*C2)
Link
http://easy-excel.com/excel-line-charts-why-the-line-drops-to-zero-and-how-to-avoid-it/